What every international property buyer needs to understand about how the pound moves – why the numbers are NOT on your side and why your pound is at risk.
There is a moment that everyone British person buying a property in Spain, France, Portugal or the USA knows. You agree a price in euros or dollars, pay a deposit, and then spend the next two months watching the exchange rate with a mixture of fascination and dread. Sometimes it moves in your favour but more often it seems not to. And when it moves against you, it tends to move fast.
You might put this down to bad luck – Sod’s Law. But in fact, like toast always hitting the carpet buttered side down, there is a scientific principle at work. It’s a pattern – measurable, repeatable and backed by a decade of data. Understanding it will not stop it happening, but it will offer you an opportunity to weigh the dice back in your favour.
The stairs and the lift
Traders have a phrase for currencies and stocks that behave the way sterling does: stairs up, lift down. The idea is simple. A currency or share price can lose value in two completely different ways. It can drift – losing a little each week, so gradually that you barely notice until you look back at where it started. Or it can crash – dropping sharply in a matter of hours or days, in response to a piece of news or a political event, before settling at a new, lower level.
The pound does both. But what makes it distinctive is the asymmetry between the two. When sterling recovers, it tends to take the stairs – grinding upward slowly, over weeks and months, in increments too small to make the financial pages. When it falls, it takes the lift: fast, stomach-dropping, and with very little warning.
For most people, this is a curiosity. For someone in the middle of a property purchase, it is a financial reality with real money attached to it.
The 60-day window
In most eurozone property transactions, the gap between paying a deposit and completing – the point at which you hand over the balance – is somewhere between 45 and 90 days. Sixty days is a reasonable midpoint. So what happens to GBP/EUR in an average 60 day period?
To test this, we took every trading day from 2016 to 2025 – 2,182 in total – and asked a simple question for each one: if you had converted pounds to euros on this day, what would the rate have been 60 days later? Would you need to find more money to complete in 60 days, or less?
The results across all ten years are unambiguous:
- 53% of 60-day windows ended lower for sterling – the pound bought fewer euros 60 days later than it did on day one
- 47% ended higher – sterling had risen
- But here is the key finding: the average loss in down periods was 2.32%, while the average gain in up periods was only 1.56%
The average loss in down periods was 2.32%, while the average gain in up periods was only 1.56%
That ratio – losses running at 1.49 times the size of gains – is the stairs and the lift expressed as a number. You win slightly less than half the time if you wait. And when you lose, you lose bigger.
Why the pound and not the dollar or the euro?
This pattern is specific to sterling. It is not something you would find to the same degree if you were moving Swiss francs, US dollars or euros.
The reason comes down to what currency traders call safe-haven status. When the world gets nervous – a financial crisis, a geopolitical shock, a pandemic – investors instinctively move their money into a small number of currencies they trust to hold their value: the US dollar, the Swiss franc, and the Japanese yen are the classic trio. The euro, as the currency of a large, diversified economic bloc, has partial safe-haven properties. Sterling does not.
This matters because it means the pound behaves like a risk asset rather than a refuge. When markets are calm and investors are confident, money flows into higher-yielding or higher-growth opportunities – and the pound tends to drift upward as part of that general optimism. But when something goes wrong, money flows out of sterling and into the safe havens. The pound falls, and it falls fast.
A typical GBP/EUR chart: slow growth and fast falls:
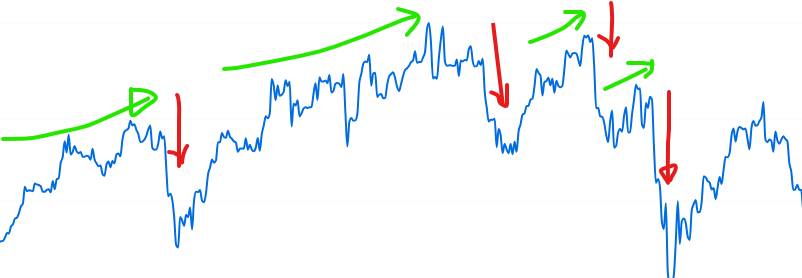
The pound to euro, July 2024 to July 2025 – stairs up, lift down
The euro, by contrast, sits on the other side of your transaction. It is the currency of 19 countries, backed by the European Central Bank, and has partial safe-haven status of its own. When things go wrong globally, the euro does not fall the way sterling does. The exchange rate between two currencies is always a relative comparison – and in the GBP/EUR pairing, it is sterling that carries the vulnerability.
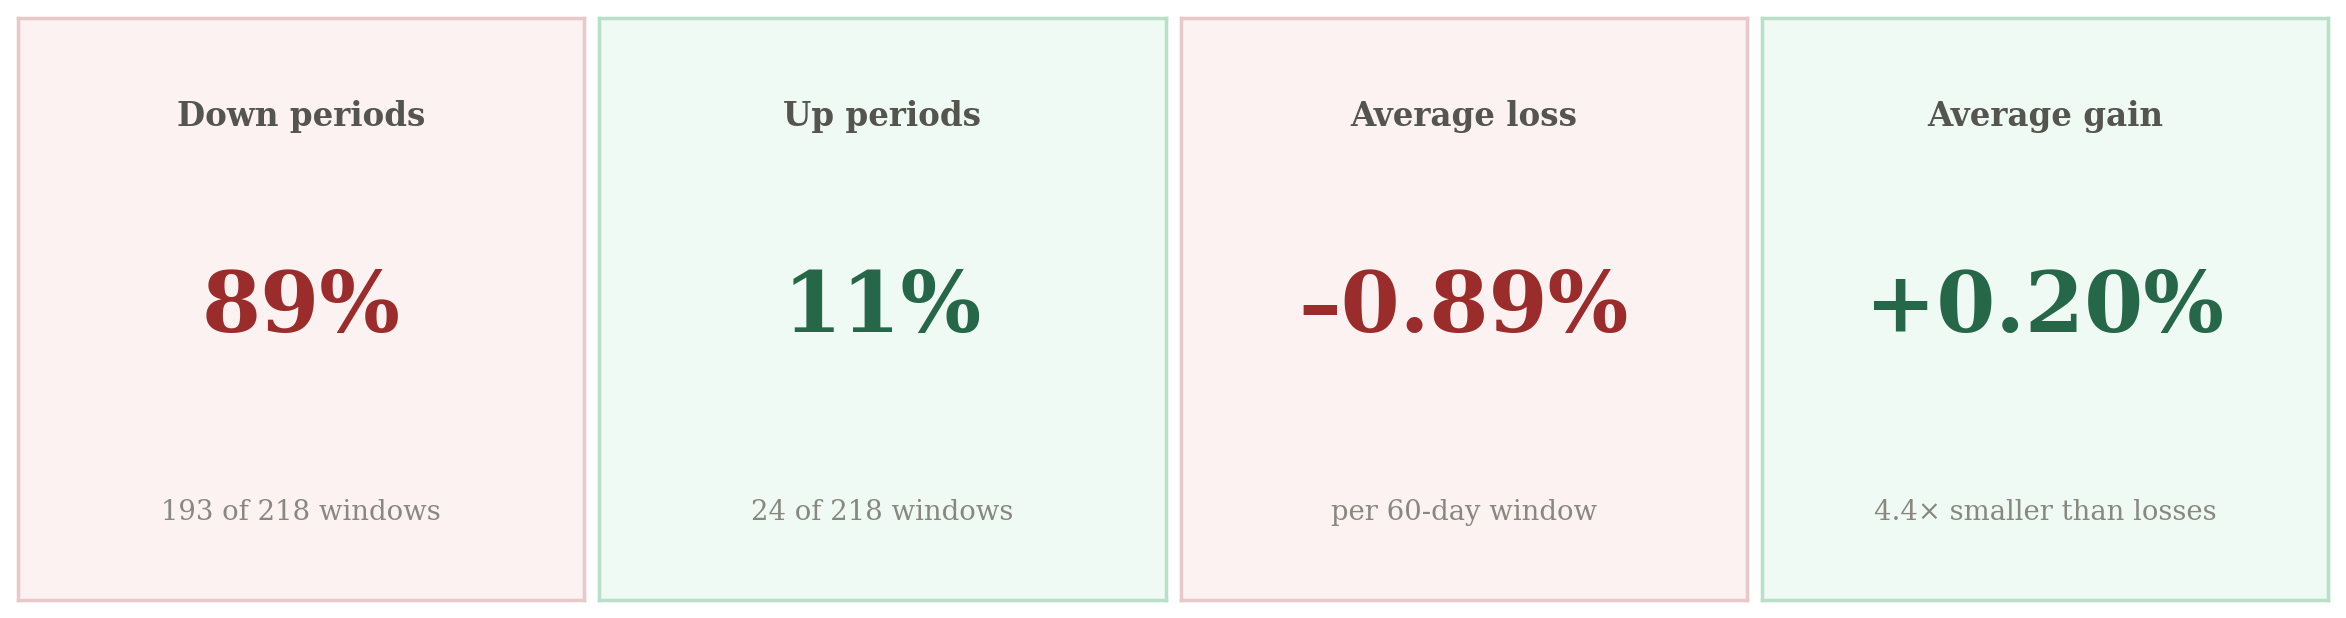
2025: the cleanest example
The most dramatic illustrations of the stairs-and-lift pattern tend to involve a crisis – Brexit in 2016, the mini-budget in 2022. But 2025 is actually the most instructive year precisely because nothing dramatic happened. There was no single shock, no identifiable moment of panic. And yet the pattern was more extreme than in almost any other year in the dataset.
The chart below shows what this looks like as a distribution. Each bar represents how many of the 218 days in which you could have signed on the dotted line for a property resulted in a 0.5% movement on completion 60 days later.
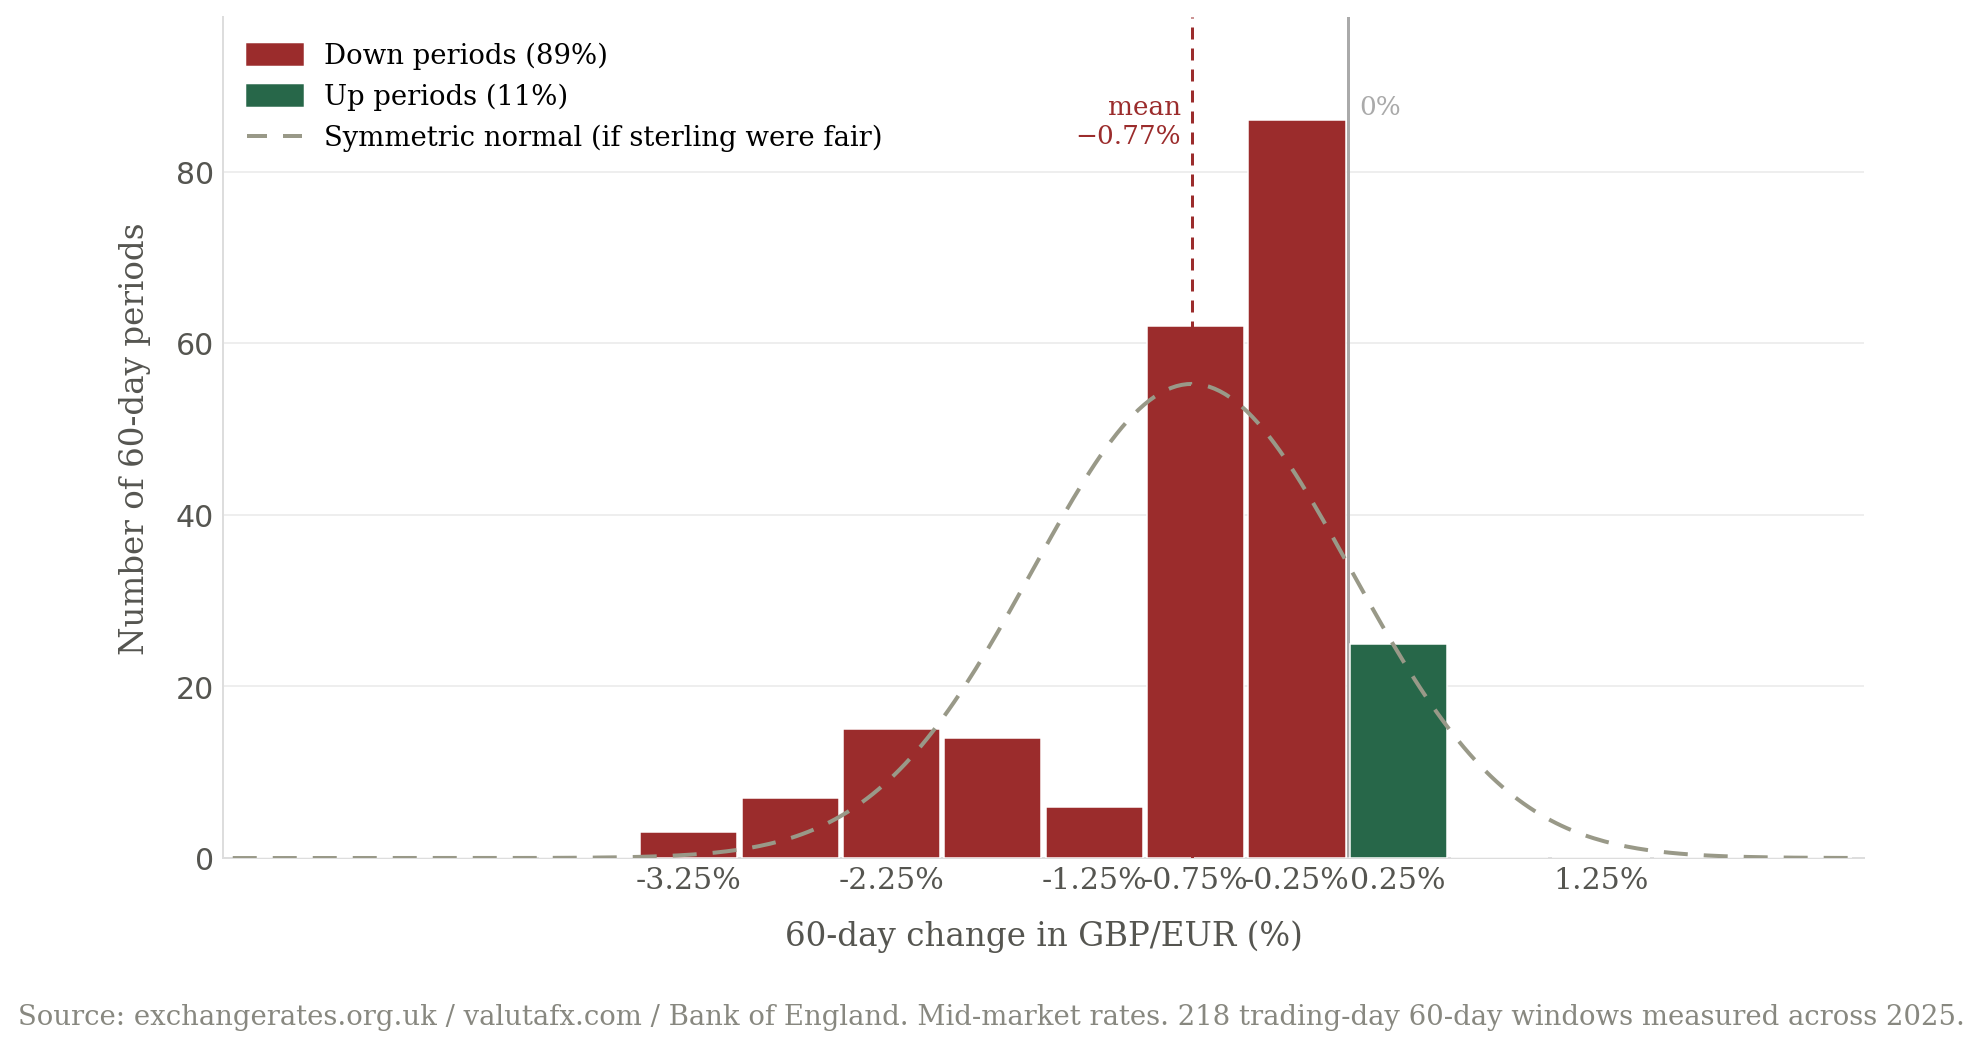
Notice three things. The tallest bars cluster around –0.25% to –0.75% – most windows involved a small loss. The right side (gains) is almost empty; no window gained more than 0.5%. The dashed curve shows where the bars would sit if sterling were symmetric. The actual data sits almost entirely to the left of it – the statistical fingerprint of a currency that takes the lift down.
The skewness of this distribution – a measure of how lopsided it is – comes in at –1.30 for 2025 alone, compared to –0.72 for the full decade pooled together. In 2025, the skew was nearly twice as pronounced as the ten-year average. And there was no Brexit, no mini-budget, no pandemic. Just the pound, being the pound.
What this means if you are buying property
Suppose you have agreed to buy an apartment in Lisbon for €400,000. You pay a 10% deposit – €40,000 – and completion is in 60 days. You need to find €360,000 at completion. At the moment you pay the deposit, the rate is €1.20. You think: €360,000 will cost me £300,000. That feels manageable.
But 60 days is enough time for the pound to move meaningfully. Based on the ten-year data:
- There is roughly a 53% chance the pound has weakened over those 60 days
- The median outcome is a loss of about 0.23% – the pound is more likely to be weaker than stronger
- In bad scenarios (bottom quartile), sterling falls by more than 2.5% – turning your £300,000 requirement into £307,500 or more
- In good scenarios (top quartile), you might save £5,000–£7,000
On a €360,000 requirement, a 3% move in the exchange rate is £9,000. A 5% move – well within the historical range of a single bad 60-day window – is £15,000. These are not rounding errors. They are meaningful sums that can affect whether a purchase is affordable.
The asymmetry matters here too. The good outcomes tend to cluster in a narrow band – most gains are modest. The bad outcomes have a longer tail, meaning the worst cases are considerably worse than the best cases are good. In other words, your pound is usually more at risk of falling than rising.
Download our Property Buyer’s Guide to Currency for a broader overview of managing exchange rate risk.
Protecting yourself
Forward contracts
When your pound is at risk, a forward contract allows you to lock in a rate today for settlement in 60, 90 days or longer. You give up the possibility of benefiting if sterling rises, but you remove the risk of a fall. Given that the median outcome is negative and the downside scenarios are worse than the upside scenarios are good, this is often a rational trade.
Market orders and rate alerts
Because the pound tends to fall quickly, at Smart Currency we provide our clients with early warning systems. A Market Order is where you tell your account manager the rate at which you want us to step in and buy the currency. That could be because that slow grind upwards has hit a rate you’re happy with, or because sterling is falling fast and you need to act now.
We also send out rate alerts to clients if there are any sharp movements in the pound to euro rate, either up or down.
Timing awareness
Sterling tends to weaken around political uncertainty, budget announcements, and global risk-off events. The mini-budget of September 2022 cost buyers completing that week roughly 6–7% on their conversion. Those who had already locked in their rate were unaffected.
What does not work is simply assuming the rate will be fine. The data suggest that slightly more than half the time, over a 60-day window, sterling will be lower than when you started. And the times it is lower tend to hurt more than the times it is higher help.
The working out
For readers who want to see the underlying numbers, here is the complete ten-year summary. Each row covers one calendar year of 60-day forward return measurements.
| Year | Key event | Up % | Down % | Avg gain | Avg loss | Ratio | Skewness |
|---|---|---|---|---|---|---|---|
| 2016 | Brexit vote | 32% | 68% | +3.1% | –4.9% | 1.59× | –0.08 |
| 2017 | Theresa May election | 48% | 51% | +1.4% | –2.7% | 1.88× | –0.10 |
| 2018 | Brexit deal paralysis | 32% | 68% | +1.2% | –1.% | 0.81× | +0.58 |
| 2019 | No-deal cliff / Boris win | 51% | 49% | +3.7% | –2.7% | 0.73× | +0.16 |
| 2020 | Covid crash (Mar) | 44% | 56% | +1.5% | –3.3% | 2.16× | –1.15 |
| 2021 | UK’s vaccine success | 65% | 35% | +1.6% | –0.5% | 0.32× | +1.27 |
| 2022 | Mini-budget (Sep) | 39% | 61% | +1.5% | –2.1% | 1.44× | –0.24 |
| 2023 | Relative calm | 65% | 35% | +1.1% | –1.2% | 1.11× | –0.38 |
| 2024 | November flash dip | 73% | 26% | +0.7% | –2.% | 2.69× | –1.66 |
| 2025 | Slow grind down | 11% | 89% | +0.2% | –0.9% | 4.42× | –1.30 |
| All years | 2,182 windows | 46% | 53% | +1.6% | –2.3% | 1.49× | –0.44 |
Methodology. For each trading day in a given year, we took the GBP/EUR mid-market rate and the rate exactly 60 calendar days later, calculated the percentage change, and classified it as up or down. Rates are interpolated from verified monthly high/low anchor points sourced from the Bank of England and others. Weekend rates carry the preceding Friday’s close.
Two years break the pattern: 2018 (Brexit paralysis produced sideways churn rather than directional moves) and 2019 (the resolution of the no-deal fear in Q4 produced gains bigger than the losses). Both are instructive – the thesis is strongest when the UK faces genuine political or macro uncertainty, and weakest when that uncertainty resolves in a positive direction. The thesis holds clearly in seven of the ten years, partially in two, and is reversed in one.
The ten-year aggregate skewness of –0.44 confirms that, pooled across the full decade, the distribution of 60-day returns is meaningfully left-skewed: the losses are not just more frequent, they extend further. This is the statistical fingerprint of a currency that takes the stairs up and the lift down.
Data and analysis by the author. Rates are mid-market and for illustrative purposes only; actual conversion rates will vary by provider and include spread. Past exchange rate movements are not a guarantee of future performance. This article does not constitute financial advice. If you are planning a currency conversion in connection with a property purchase, you should speak to a regulated currency broker or independent financial adviser.